The power of SirV

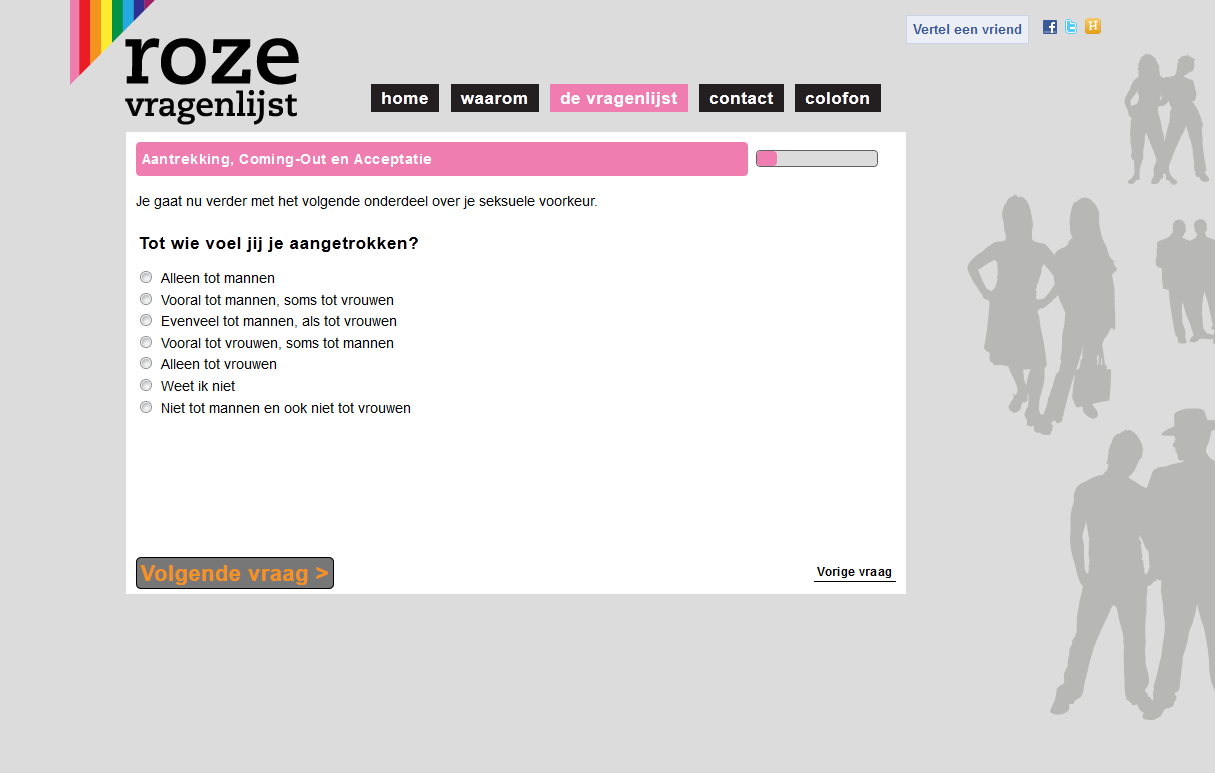
Surveys may look simple, but they can be rather complex 'under the hood'. You might want to address a female user differently than a male user. It can often be necessary to ask questions based on answers given earlier in the survey, for instance "When did you move from Denmark to Sweden?". The countries "Denmark" and "Sweden" could be answers to previous questions.
SirV supports all variations of tailoring and routing. On your survey's secure administrative page, you will see the complete flow in a flowchart (see image on the right). While your survey is running you will know the exact number of respondents and their answers at any given time.
Respondents can register themselves or – in the case of a closed survey – they can be invited. Invitations can be sent by e-mail, in a layout complying with your company house style.
Results & reports
When all respondents have completed your survey, the results need to be gathered and interpreted. Presenting the results in a way your organization can easily understand is essential. SirV offers tools that make this possible. For instance, you can download all the results as an Excel-spreadsheet.
Besides delivering your raw data, we can prepare a complete report for you. Depending on your wishes, we will create a report containing all the relevant information and figures.
Real-time statistics
While the survey is running, you can keep a close eye on the results gathered. You can check for trends online using interactive charts. You can see the results of the demo here.
Advanced statistical analysis
While your survey is running you can monitor the answers given by respondents. Contingency tables can be generated to check for correlations between questions and answers.
Some of the more scientific options SirV provides:- Contingency tables
- Cramérs V calculation
- Chi-square test
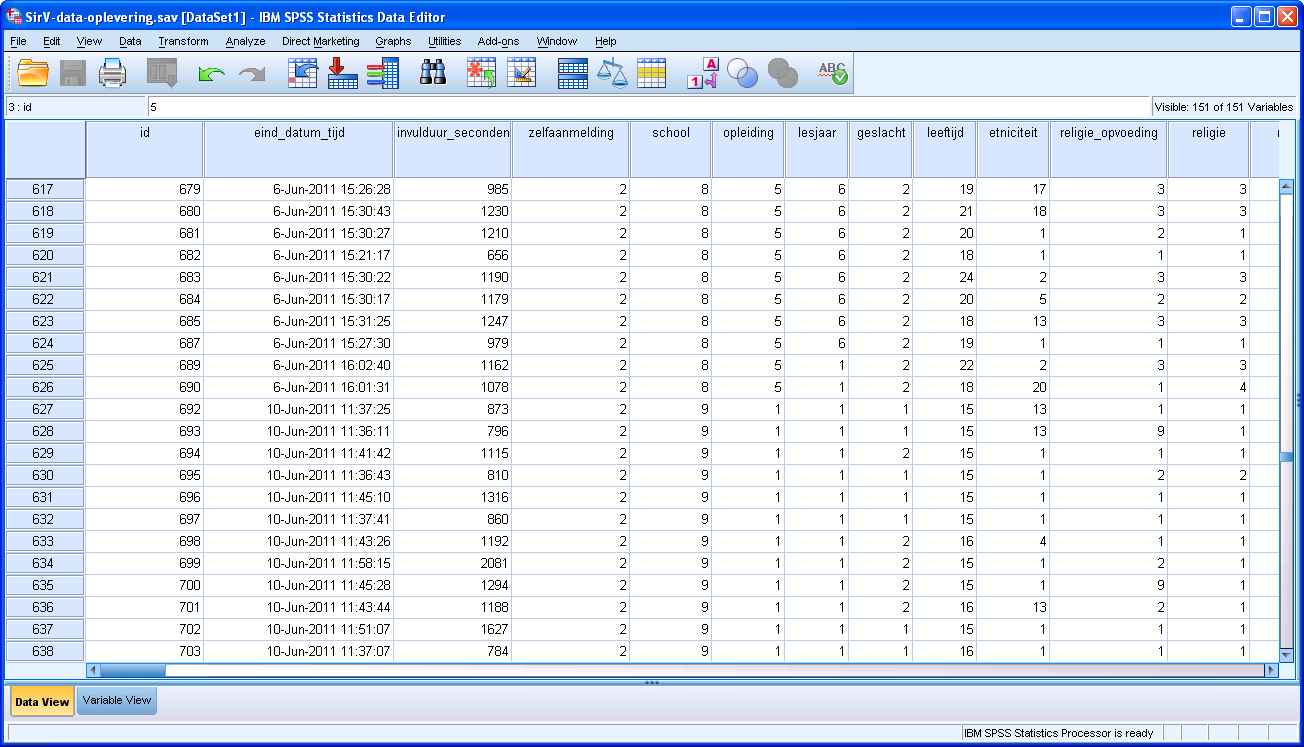
- Delivery of data in SPSS file format
For advanced statistical analysis like regression or structural equation modelling you can use software like SPSS, Stata, Amos, Lisrel or Mplus.


